Data Analysis
for my project I just used the given example:
"Assume you have 3,000 songs downloaded to your mobile phone. Of these songs, 50 songs are by your favorite artist. If you play the songs on random shuffle, how many songs would you have to listen to in a row before you heard a song by your favorite artist?"
However I'm also going to go off of this on: What numbers are called the most?
Graph

What does the histogram show and mean?
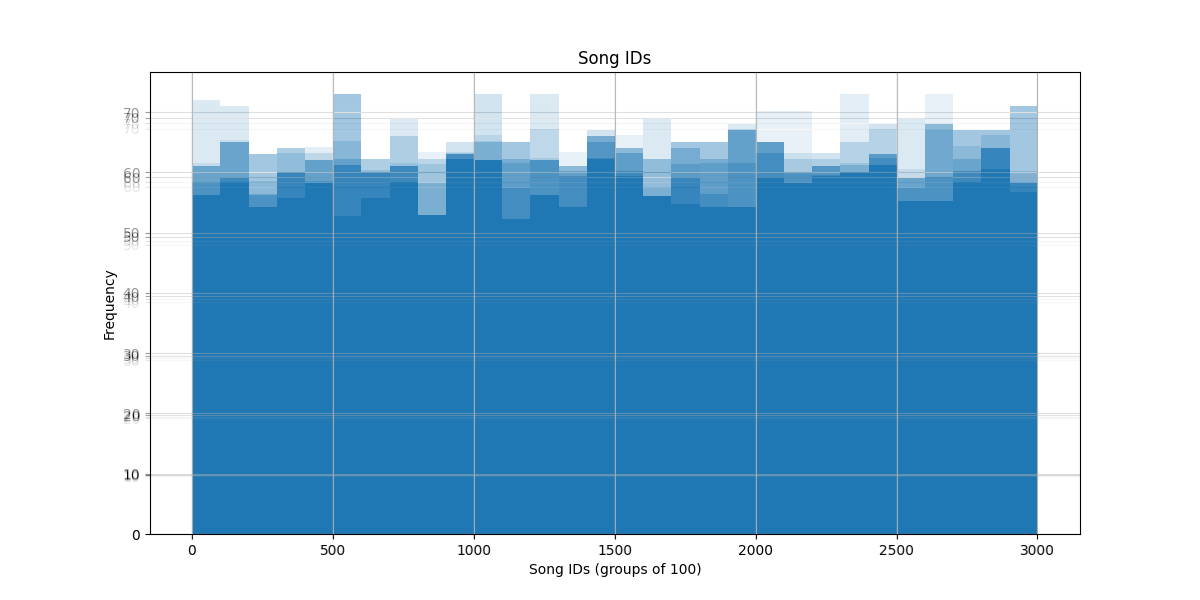
The histogram on the left shows the Song IDs and the frequency of them, the binsize was set to 100 for this example.
First and most obviously it is semetrical, but what I find interesting is how the simulation favored some number ranges, but first, I'm going to see abou the chance of a favorite song (song IDs 1-50)being played, from the 3000 songs, below is the code I used to generate the order and it will give a unique example.
therileticly you could get a perfect 50 out of 3000, or 0.016̅6̅ roughly 1.6% chance, but in acuality it goes from around 40-60 its a wide range.
Now I find it interesting that the method I used liked the 500s so much, and If I, 1 knew where the code is and 2 had the time and/or pacince to do more tests, could do more tests, I want to try changing the amount of scrambles of the list, I had done 5, I wonder if I did 1, If the 100s would be chosen more.